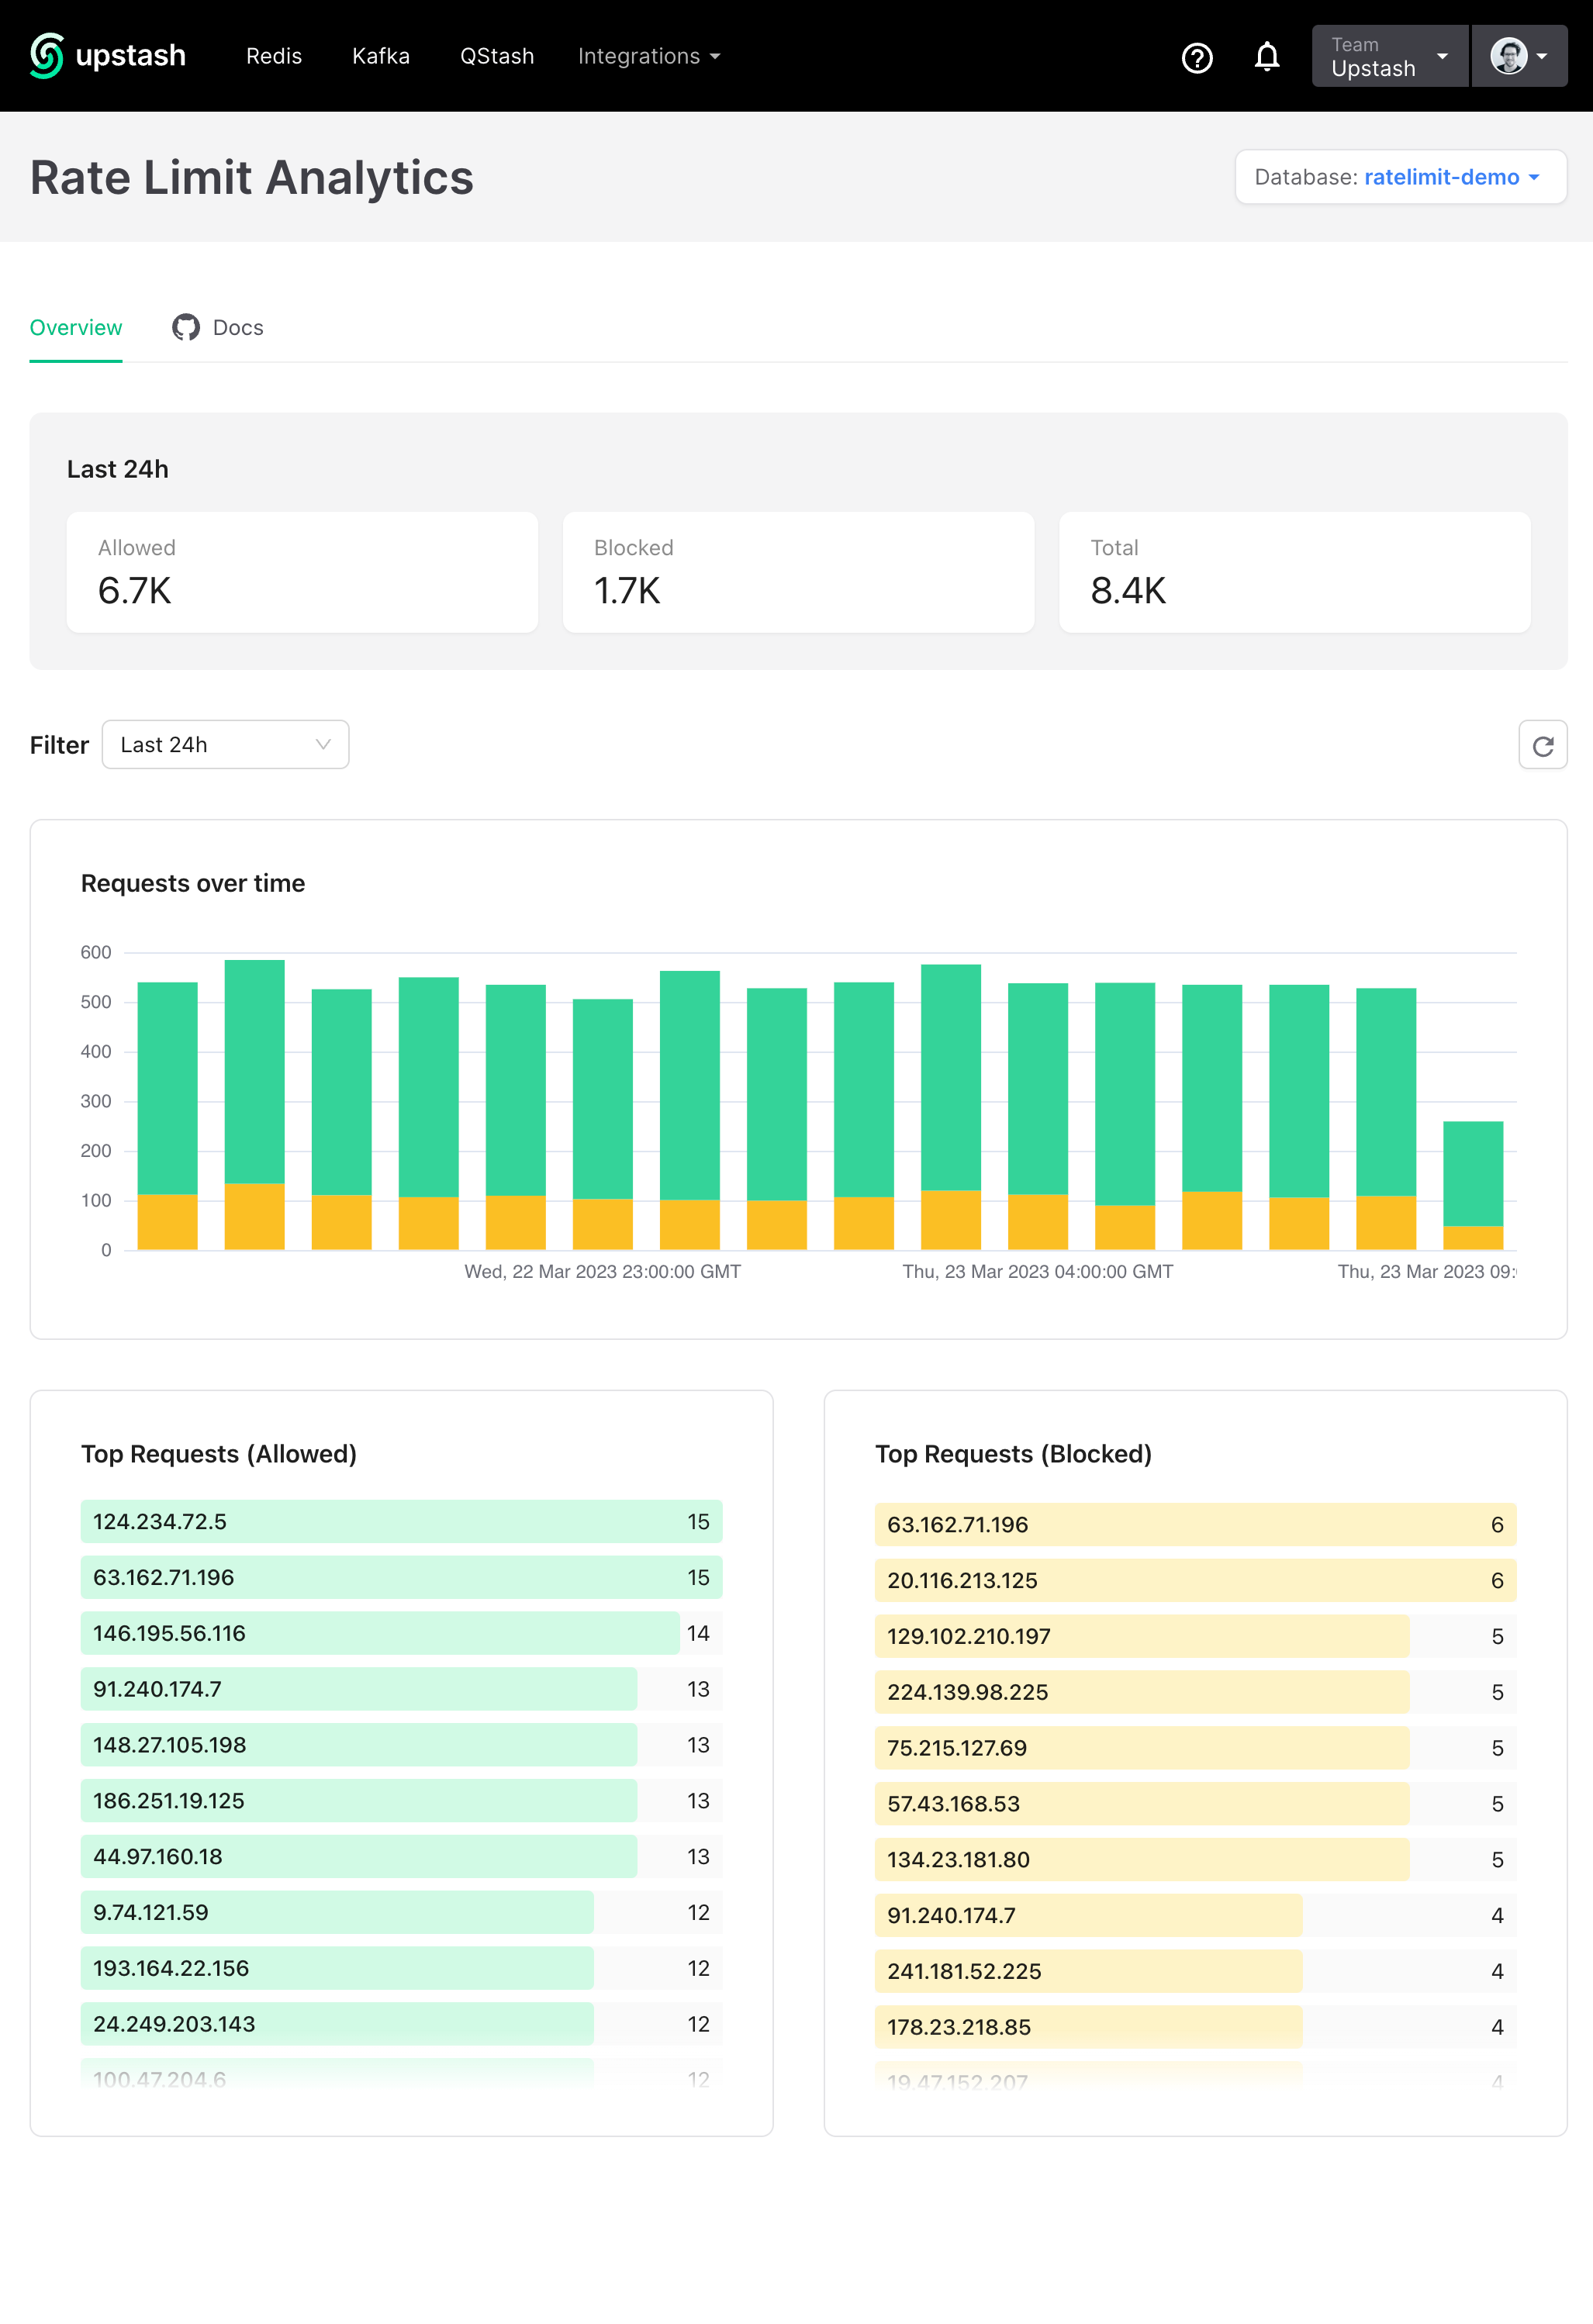
We are thrilled to announce the latest addition to our @upstash/ratelimit library, the Rate Limit Analytics! As the library gains more popularity, we have been receiving valuable feedback on how we can improve it. One of the most requested features was a way to have a better view of the overall performance and how limits apply to different users in an application. The Rate Limit Dashboard allows you to do just that. You can now easily visualize and analyze your rate limits, giving you better insights into your application's performance. You can access the Rate Limit Dashboard by visiting console.upstash.com/ratelimit after enabling analytics (see below).

If you're not familiar with @upstash/ratelimit, it is a TypeScript library
built on top of Upstash for Redis®. It allows you to easily
add rate limiting to your application and works over HTTP, making it perfect for
stateless runtimes like serverless and edge. You can learn more about how it
works by reading our announcement or by checking out
the repository.
Enabling Analytics
Enabling analytics for @upstash/ratelimit is completely optional and does not
add any latency to your application's critical path. You can enable analytics by
configuring it in the Rate Limit constructor:
import { Ratelimit } from "@upstash/ratelimit";
import { Redis } from "@upstash/redis";

const ratelimit = new Ratelimit({
  redis: Redis.fromEnv(),
  limiter: Ratelimit.fixedWindow(10, "10s"),
  analytics: true, // <- add this line
});
Console
Once you've enabled analytics, you can access the Rate Limit Dashboard by visiting console.upstash.com/ratelimit. From there, you can select the database you're using for rate limiting and start monitoring.

The best part is that using the @upstash/ratelimit SDK and dashboard is
completely free! You only pay for the underlying database used to store the
limits and analytics data. Our Redis free tier allows up to 10,000
requests per day for free, and if you need more, you can upgrade for just
$0.20 per 100,000 requests.
We welcome any questions or feedback you may have. Please feel free to reach out to us on Twitter or Discord.
Relevant links:
